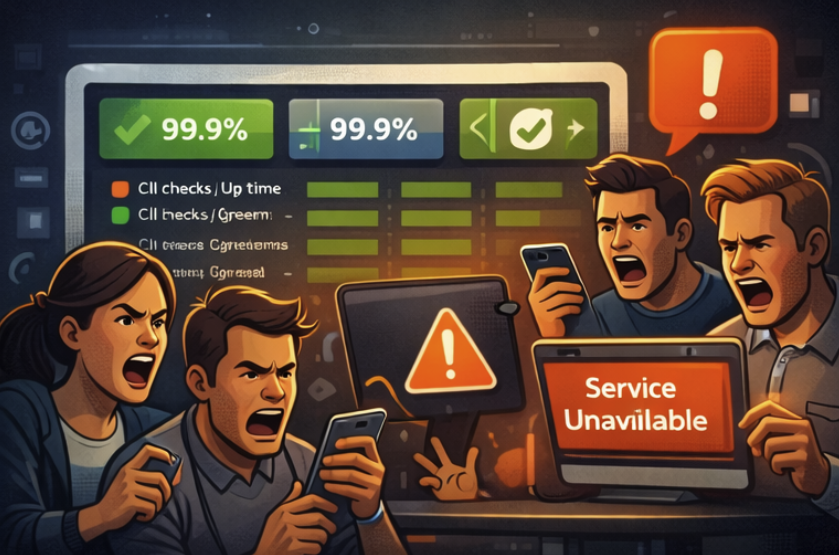
If You Need a Dashboard to Know You’re Down, You’re Already Late

Dashboards don’t wake you up
Dashboards are passive. They sit there, waiting to be looked at.
Outages don’t wait.
If a service goes down at 03:12 and no one is actively staring at a screen, the dashboard is effectively useless. The system is down, users are impacted, and nothing happens until a human notices.
That delay is not a tooling issue. It’s a design mistake.
Dashboards are built for explanation, not reaction
Dashboards answer questions like:
- What happened?
- When did it start?
- Which metric moved first?
Those are post-incident questions.
Incident response needs answers to different questions:
- Is something broken right now?
- Who owns it?
- Who needs to act?
Dashboards are optimized for exploration. Incidents require interruption.
The hidden assumption behind dashboard-first ops
Relying on dashboards assumes at least one of these is true:
- Someone is always watching
- Engineers will notice anomalies instantly
- Users will tolerate the delay
None of these assumptions hold in real systems.
Modern infrastructure is distributed, noisy, and global. Expecting humans to continuously poll dashboards is unrealistic and fragile.
Green dashboards and broken user experiences
One of the most common failure modes looks like this:
- Core metrics look green
- Edge cases fail silently
- A region, provider, or dependency is degraded
- Users report issues before alerts fire
Dashboards show averages. Users experience specifics.
By the time the dashboard clearly shows red, the outage has already done damage.
Reaction requires trust, not visibility
Fast incident response depends on one thing: trust.
Engineers must trust that when an alert fires, it matters.
That trust is impossible if alerts are noisy, delayed, or ambiguous. In those environments, people check dashboards to confirm alerts, which adds latency exactly when speed matters most.
Alerts are not a lesser form of observability
There is a quiet hierarchy implied in many teams:
- Dashboards are "real observability"
- Alerts are a crude layer on top
This is backwards.
Alerts are a product. They encode decisions:
- What failure matters
- When humans should be interrupted
- Who is responsible
Dashboards cannot make those decisions. They only display data.
The correct role of dashboards
Dashboards are invaluable during and after incidents.
They help teams:
- Understand blast radius
- Validate recovery
- Perform root cause analysis
But they should never be the trigger.
If the first signal of an outage is a human noticing a graph, the system has already failed operationally.
A better mental model
Think in layers:
- Automated detection confirms real failure
- A trusted alert interrupts the right humans
- Dashboards support investigation and recovery
Dashboards explain. Alerts initiate. Humans resolve.
Final thought
Dashboards make outages understandable.
Alerts make them shorter.
If you need to look at a dashboard to know you’re down, you’re already late.
Explore related uptime monitoring solutions
Compare tools with our UptimeRobot alternative guide for faster downtime alerts.
Reach teams instantly with Telegram downtime alerts or SMS alerts for critical incidents.
Share outages transparently with a public status page that updates automatically.
See how pricing plans scale from free monitoring to multi-site coverage.
Monitor your sites with AlertsDown
Monitor your sites with AlertsDown – get started for free in 2 minutes.